AI / ML Tribune
From Trained Model to Live Service: Deploying Sentiment Analysis API Ready for Production Traffic
From model artifact to production endpoint: serving a DistilBERT sentiment classifier with FastAPI, Redis, and Kubernetes — and holding p99 under two seconds at 50+ requests a second.
By Ambro Quach
Request path — POST /project/bulk-predict
Tail latency — to scale vs the 2.0s SLO (right edge)
The Primer — A Quick Glossary
Here is a quick guide to the metrics in this project.
SLO (Service Level Objective): The speed limit we promised to hit. For this project, the strict rule was that no request is allowed to take longer than two seconds.
p99 Latency: The speed of the slowest 1% of requests. If the p99 is 1.66 seconds, it means 99 out of 100 people got their answer faster than that — the ultimate test of a system's reliability under stress.
Median Latency (p50): The exact middle — the typical speed the average user experiences.
The Cache Fast-Path: A memory shortcut. If someone asks the model to analyze a sentence it has already seen, the system returns the stored answer instantly, bypassing the slow AI model entirely.
Cold Start: The time it takes for the system to wake up and spin up a new copy of the AI model when traffic suddenly spikes.
Overview
This project takes a fine-tuned DistilBERT sentiment classifier (DistilBERT base, fine-tuned on SST-2) from a model artifact to a fully deployed, production-grade prediction API. The model is served through a FastAPI application with Pydantic-validated request and response contracts, cached with Redis, containerized with Docker, and deployed to AWS Elastic Kubernetes Service with horizontal pod autoscaling and Istio path-based routing. The central tension is that transformer inference on CPU is inherently slow, while the service must hold a p99 latency under two seconds at production load. Four engineering decisions close that gap: aggressive Redis caching so the median request never reaches the model, baking the model into the container image for fast pod cold-starts during autoscaling, offloading blocking inference to a thread pool to keep the async event loop responsive, and a hard timeout that degrades to a 504 rather than hanging. Across three sustained ten-minute k6 load tests at ten virtual users and a 95% cache rate, the service held a p99 latency of 1.57–1.70 seconds, sustained 52–56 requests per second, and succeeded on better than 99.8% of roughly 33,000 requests per run — with a median latency of 48 milliseconds on the cache fast-path.
I. Shipping a Model Is Not Training a Model
Training a model and shipping one are different disciplines. A notebook that prints 91% accuracy proves a model can work; it says nothing about whether a stranger can POST a sentence to a URL and get an answer back in under two seconds while a thousand other requests are in flight. This project is the second discipline — taking a fine-tuned DistilBERT sentiment classifier from a model artifact to a fully deployed, production-grade prediction API: served with FastAPI, cached with Redis, containerized with Docker, deployed to AWS Elastic Kubernetes Service, and load-tested with k6 and Grafana.
The hard part is a tension at the center of ML serving: the model is slow. DistilBERT is a 66-million-parameter transformer, roughly 250 MB on disk, running sentiment inference on CPU — hundreds of milliseconds to a full second per uncached call. The target was a p99 latency under two seconds at production load. The whole project is the story of four engineering decisions that close that gap: cache aggressively, bake the model into the image, keep inference off the event loop, and degrade gracefully under timeout.
II. The Model
The classifier is DistilBERT base uncased, fine-tuned on SST-2 (the Stanford Sentiment Treebank) — a binary POSITIVE / NEGATIVE sentiment model. Training itself is a footnote here: a reference train.py uses the HuggingFace Trainer over GLUE/SST-2, five epochs at a 2e-5 learning rate and batch size 512, which transfer-learned in about five minutes on 2× A4000 GPUs and pushed the artifact to the HuggingFace Hub. On CPUs that same training would have taken days.
In production we don't train — we serve. The application loads the model once at startup and runs inference through the HuggingFace transformers pipeline, capped at 512 tokens per input:
Each prediction returns both labels with their softmax scores, so a caller sees not just the verdict but the model's confidence in it.
III. The API
The service is a FastAPI application with a strict request/response contract enforced by Pydantic. The input is a batch of strings; the output is, for each string, a list of label/score pairs:
These models do double duty: they document the contract and they enforce it — a malformed body (a missing field, a null, the wrong type) is rejected with a 422 before it ever reaches the model.
The interesting decision is concurrency. PyTorch inference is CPU-bound and blocking; calling it directly inside an async handler would stall the event loop, and every other in-flight request would stall with it. So inference is pushed onto a thread pool, and the whole call is wrapped in a timeout that degrades to a 504 rather than hanging:
The app is mounted as a sub-application under /project, alongside a /health endpoint for Kubernetes liveness checks.
IV. Caching — Where the Speed Comes From
A transformer on CPU will never be fast per call. The trick is to call it as rarely as possible. A Redis cache sits in front of the model as middleware: an identical request body returns a stored result instead of re-running inference.
The effect is a bimodal latency distribution. A cache hit returns in tens of milliseconds; a cache miss pays the full model-inference cost. At the production target of a 95% cache rate, 19 of every 20 requests take the fast path — which is exactly why the median latency lands at 48 milliseconds while the model itself is an order of magnitude slower. Caching here isn't an optimization; it's the architecture. It also shields the endpoint from abuse: a flood of repeated requests is absorbed by Redis and never touches the model.
V. Baking the Model Into the Image
A subtle systems decision determines whether autoscaling works at all. The naïve approach loads the model from the HuggingFace Hub when the app starts. That's fine for one pod — but the entire point of Kubernetes is that new pods come online under load. If each new pod has to download ~250 MB from HuggingFace before it can serve traffic, then exactly when you need capacity most — a traffic spike — your new pods are the slowest to arrive, and latency spikes while they catch up.
The fix is to bake the model into the Docker image at build time. The image balloons to roughly 8.3 GB, but a new pod is ready to serve the instant it's scheduled, with no network pull on the critical path. The cost (a large image) is paid once at build; the benefit (fast cold-starts) is paid back on every scaling event.
VI. Deploying to Kubernetes
The application runs on AWS EKS, deployed with kustomize overlays — a dev overlay for local Minikube and a prod overlay for the cluster, sharing one base. Three services run together: the project API, a sibling lab API, and Redis. An Istio VirtualService routes by URL path, so a single hostname can front multiple services:
Each API pod gates its own startup with init containers that block until Redis DNS resolves and Redis is accepting connections — so a pod never reports "ready" only to fail its first cached request. A HorizontalPodAutoscaler adds and removes pods as CPU load rises and falls, and the image is pulled from AWS ECR.
VII. Testing
Confidence in a serving API comes from testing the unhappy paths as much as the happy one. The pytest suite covers the contract end to end — the health check, well-formed single and batch predictions, and the label/score shape of every response — but most of it is adversarial:
| Case | Input | Expected |
|---|---|---|
| Empty batch | {"text": []} | 200, empty predictions |
| Null field | {"text": null} | 422 validation error |
| Missing field | {"some_field": [...]} | 422 |
| Invalid JSON | invalid json[] | 422 |
| Wrong method | GET on the predict route | 405 |
| Unknown route | GET on an unmounted path | 404 |
| Numbers / whitespace only | ["123", " "] | 200, still classified |
The Pydantic models turn an entire class of bad input into a clean 422 for free; the tests prove it.
VIII. Load Testing — Does It Hold?
The real exam is sustained load. A k6 script ramps to 10 virtual users, holds for seven minutes, and ramps down — each user POSTing sentiment requests in a loop, with payloads engineered to hit a 95% cache rate to match the production target:
Across three independent ten-minute runs, the service held the line:
| Metric | Run 1 | Run 2 | Run 3 |
|---|---|---|---|
| p99 latency | 1.70 s | 1.57 s | 1.66 s |
| median latency | 48 ms | 48 ms | 50 ms |
| p95 latency | 1.37 s | 1.03 s | 0.92 s |
| throughput | 52 req/s | 56 req/s | 52 req/s |
| success rate | 99.84% | 99.91% | 99.82% |
| total requests | 32,995 | 35,376 | 32,800 |
Every run cleared the p99 < 2 s threshold, sustained 50+ requests per second, and succeeded on better than 99.8% of requests. The median sat at ~48 ms — the cache fast-path — while the p99 absorbed the cold-miss tail. The handful of failures per run are the timeout 504s from uncached requests landing during a scaling event: exactly the case the graceful-degradation path was built for.
IX. In Production — The Grafana Dashboards
With the system live on EKS, Istio's service-mesh telemetry feeds Grafana dashboards that tell the same story from the infrastructure's side.
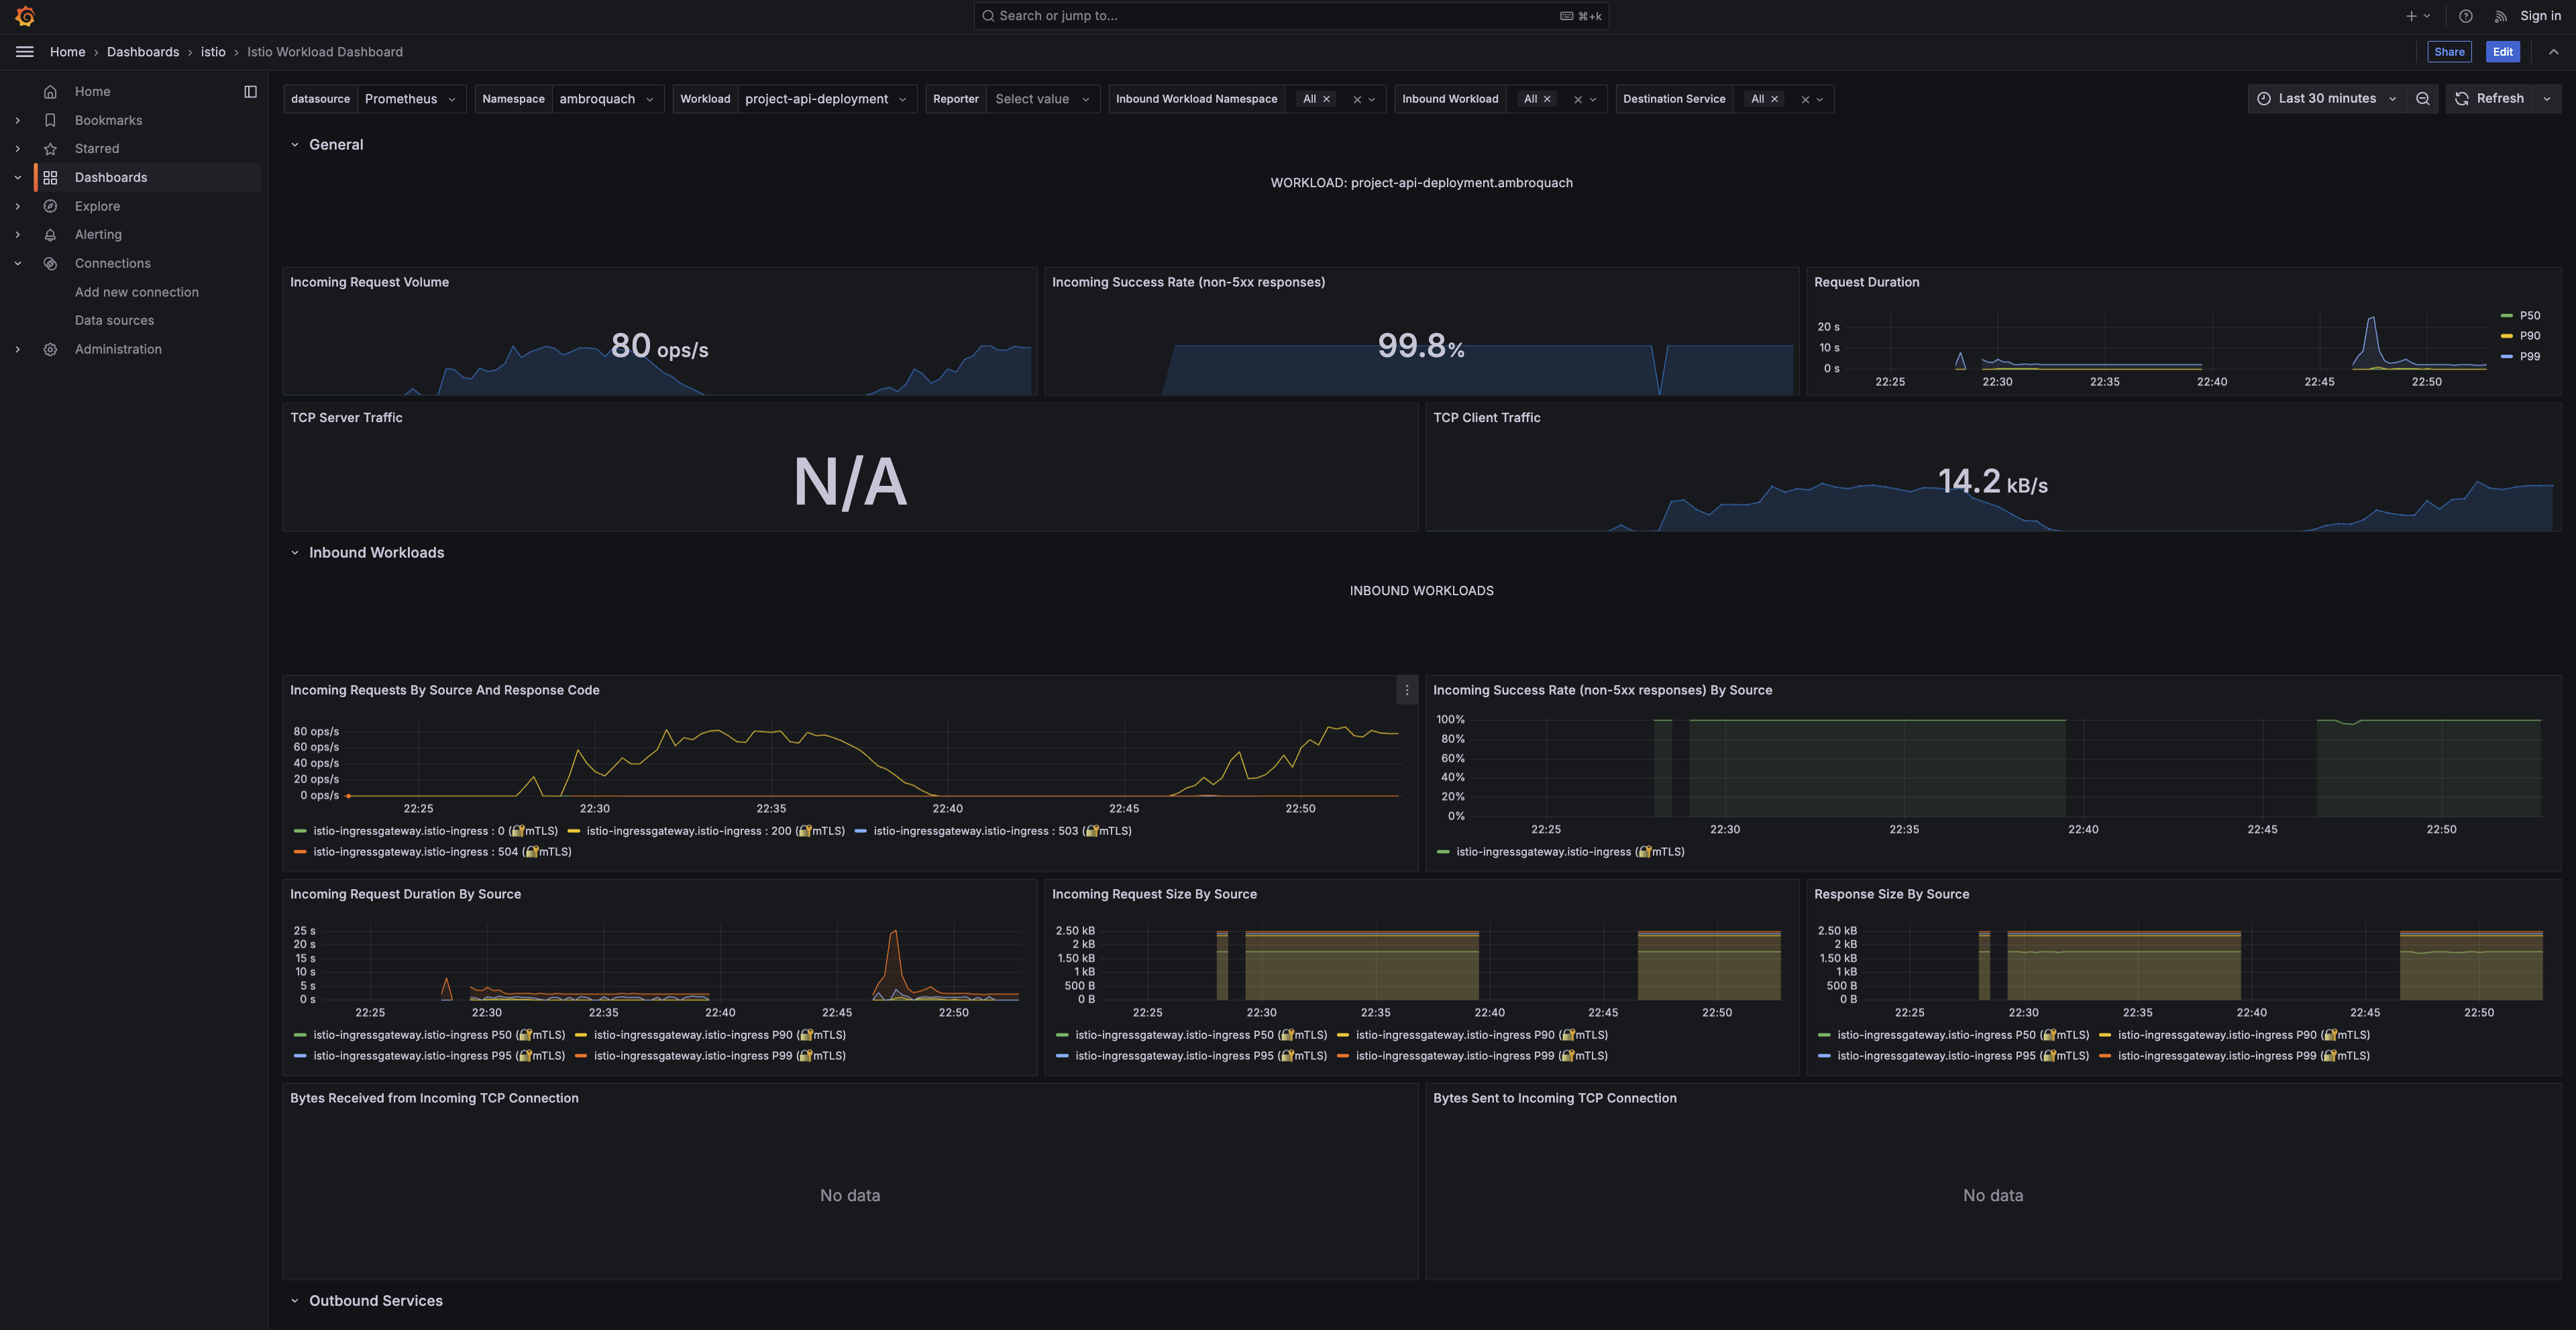
The Kubernetes workload dashboard for the project API during the load test: ~80 ops/sec incoming request volume and a 99.8% non-5xx success rate, with P50 / P90 / P99 request-duration curves.
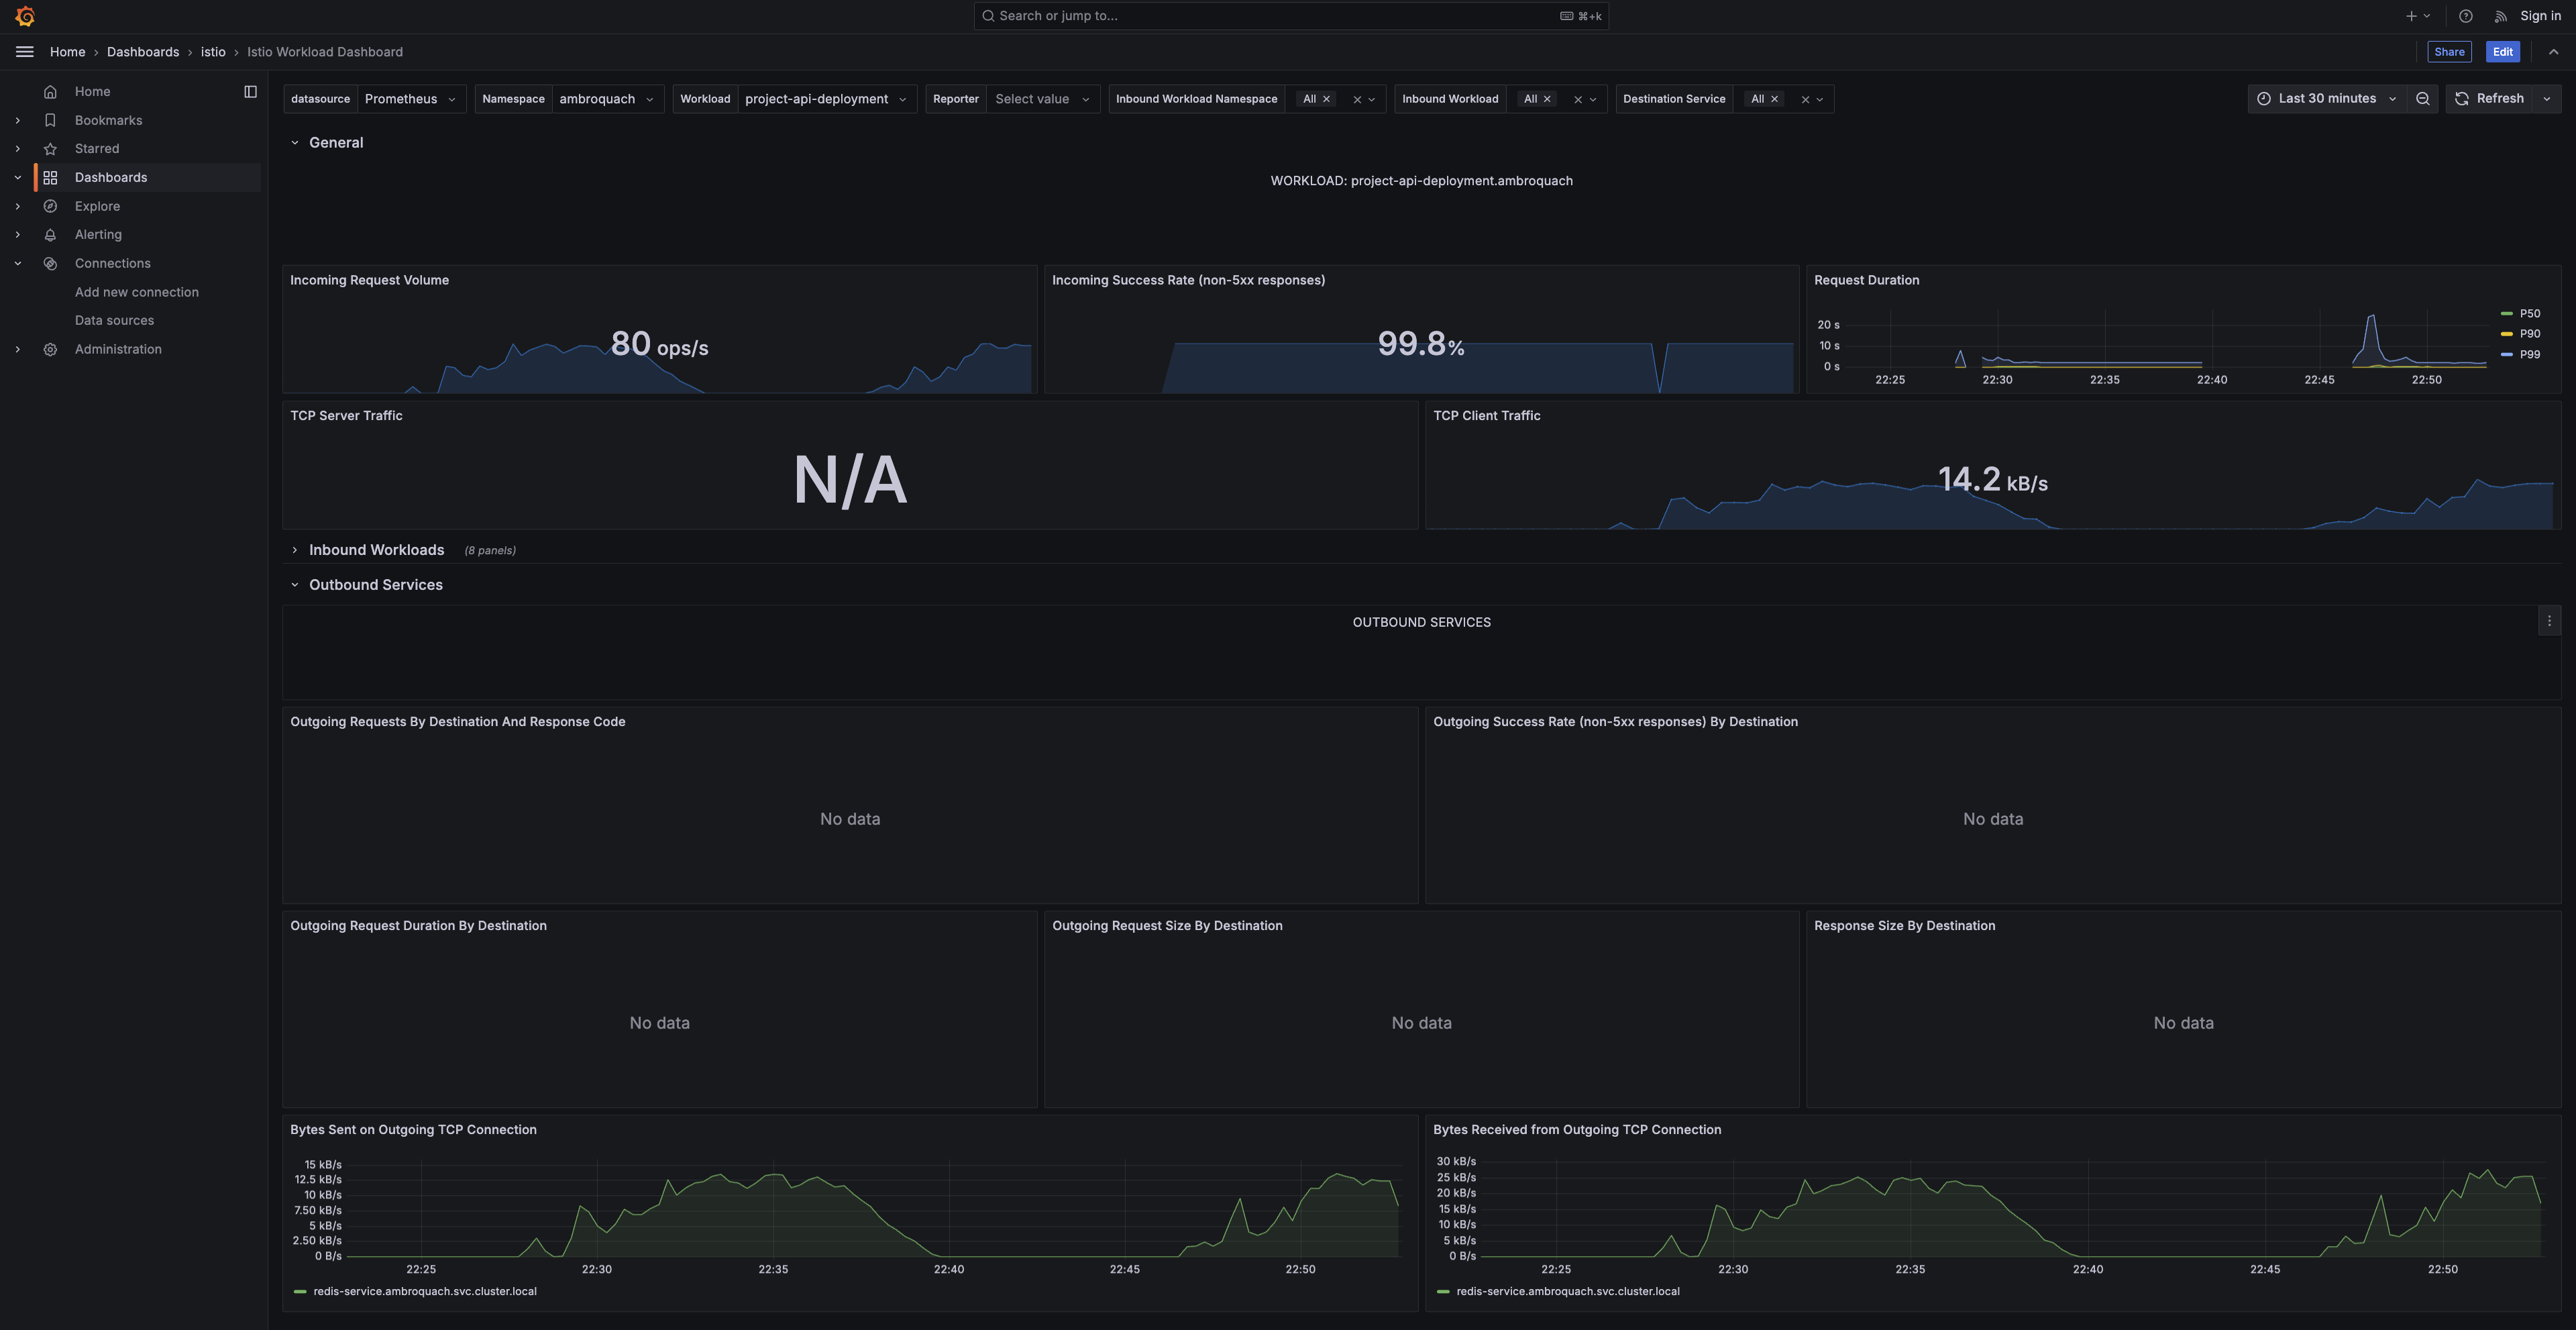
Inbound request duration and request/response sizes, broken down by source workload — the traffic arriving through the Istio ingress gateway.
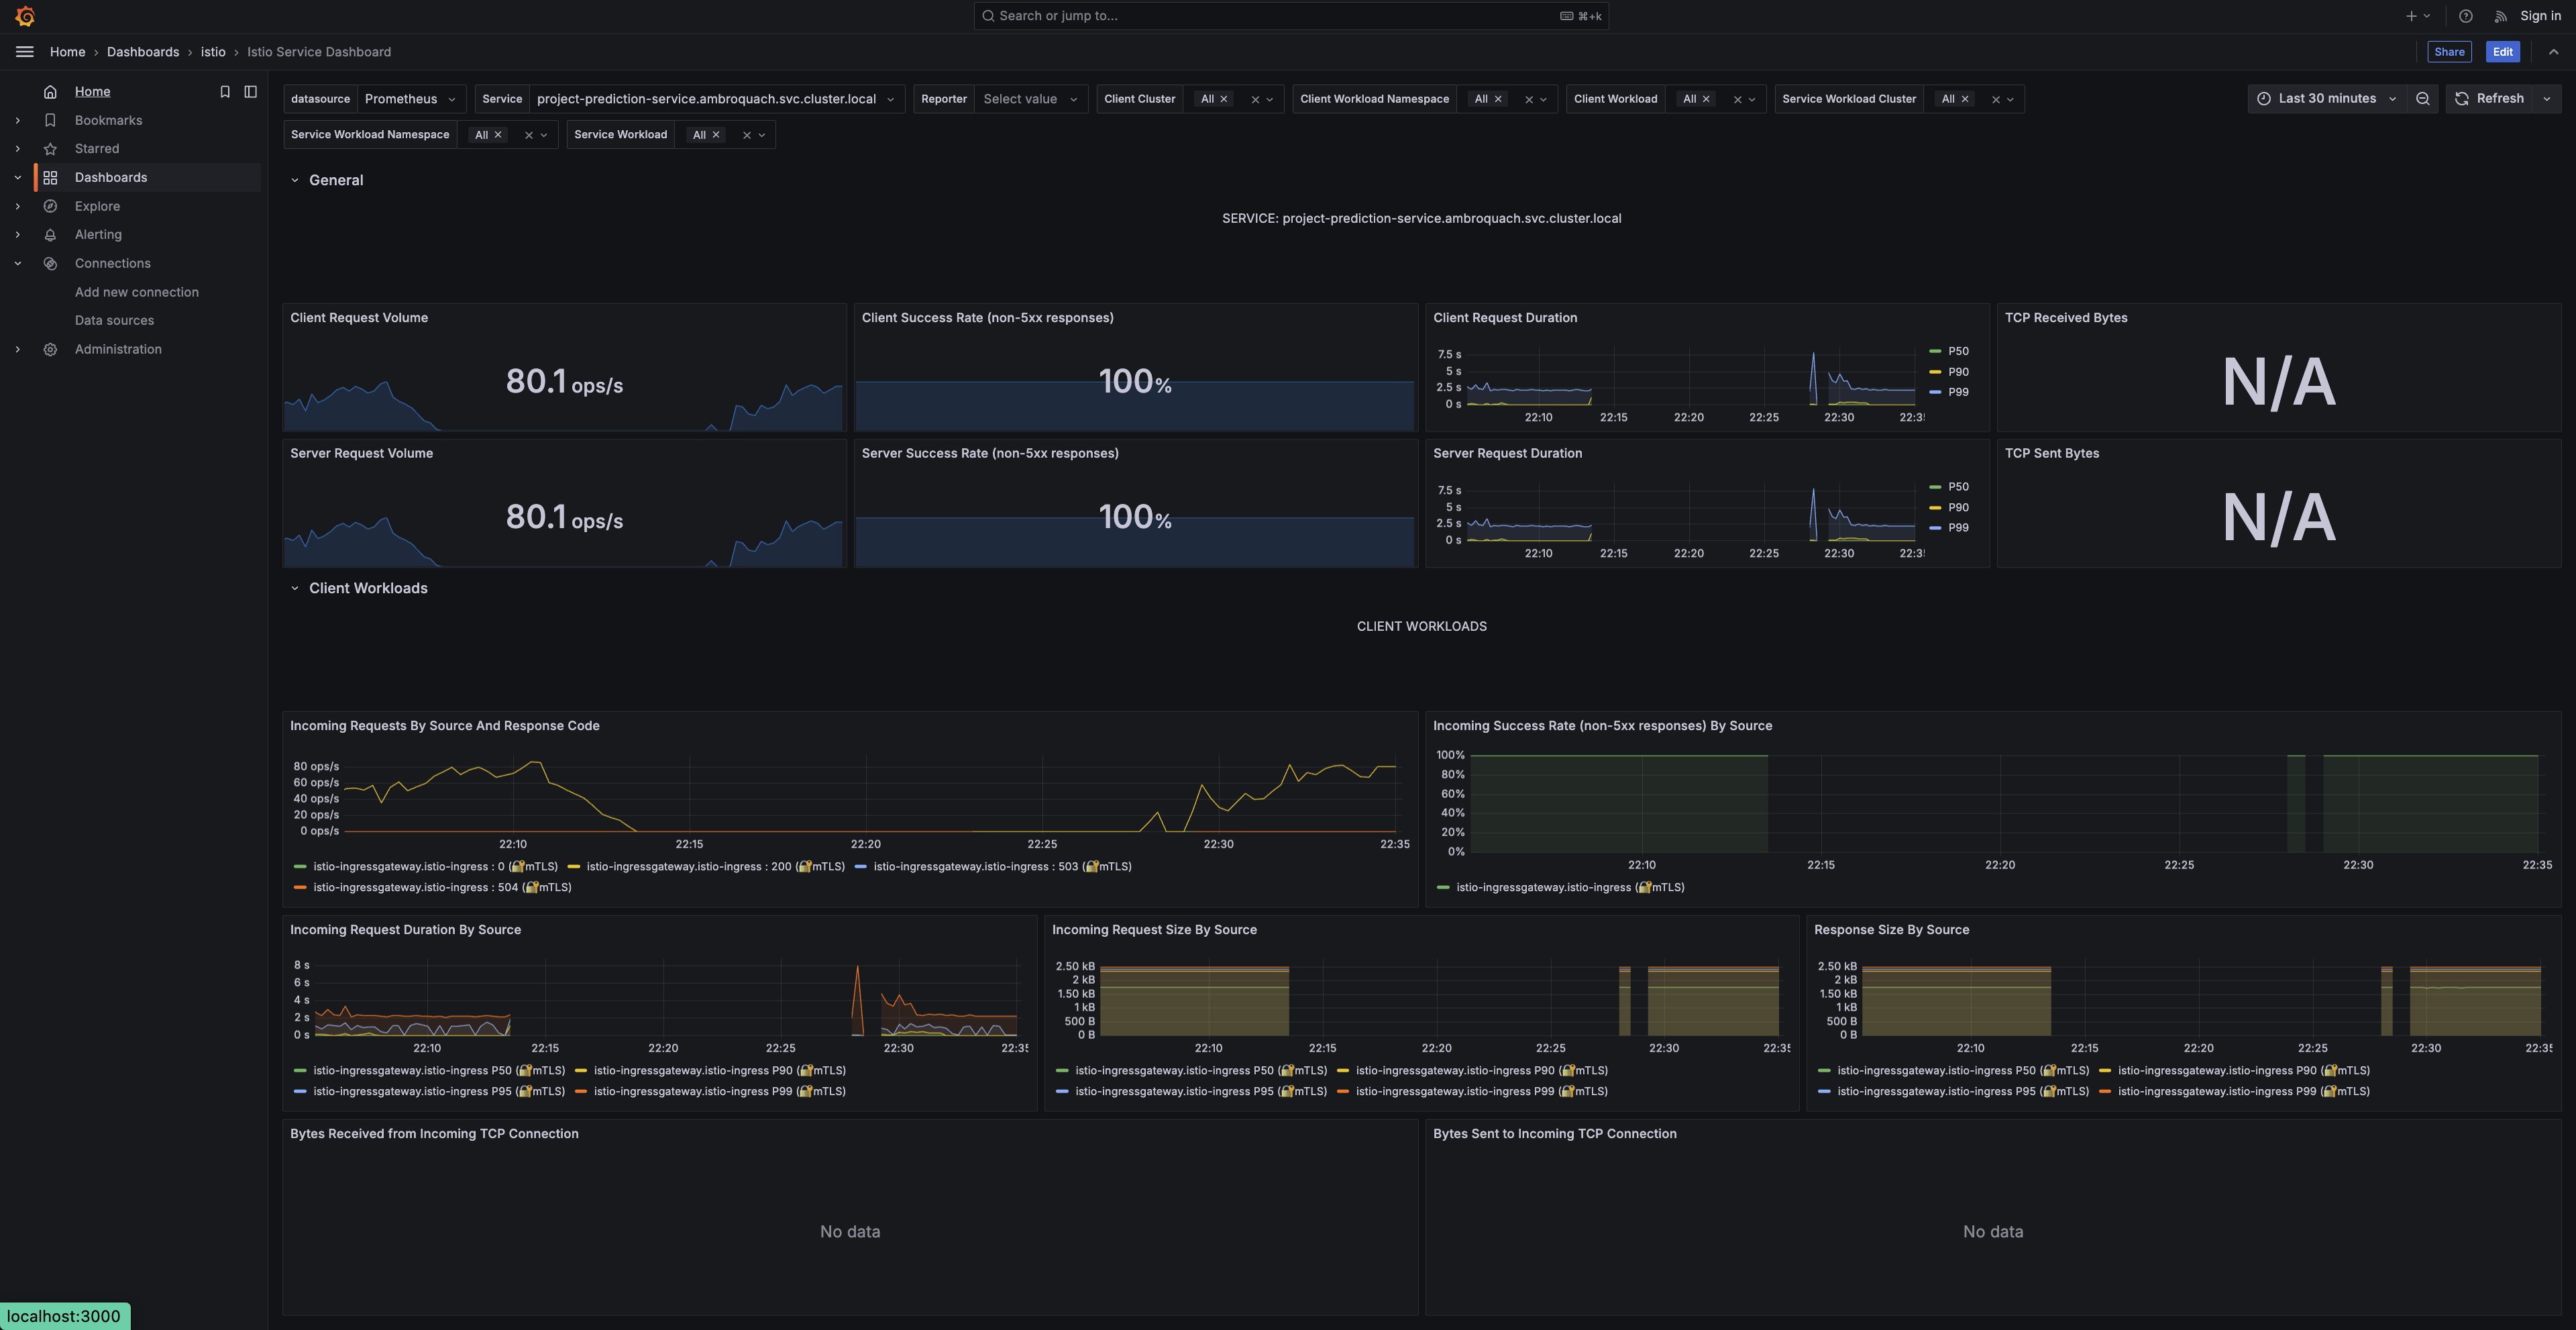
The project-prediction service dashboard: ~80 client and server requests/sec at a 100% success rate, with client- and server-side request-duration percentiles.
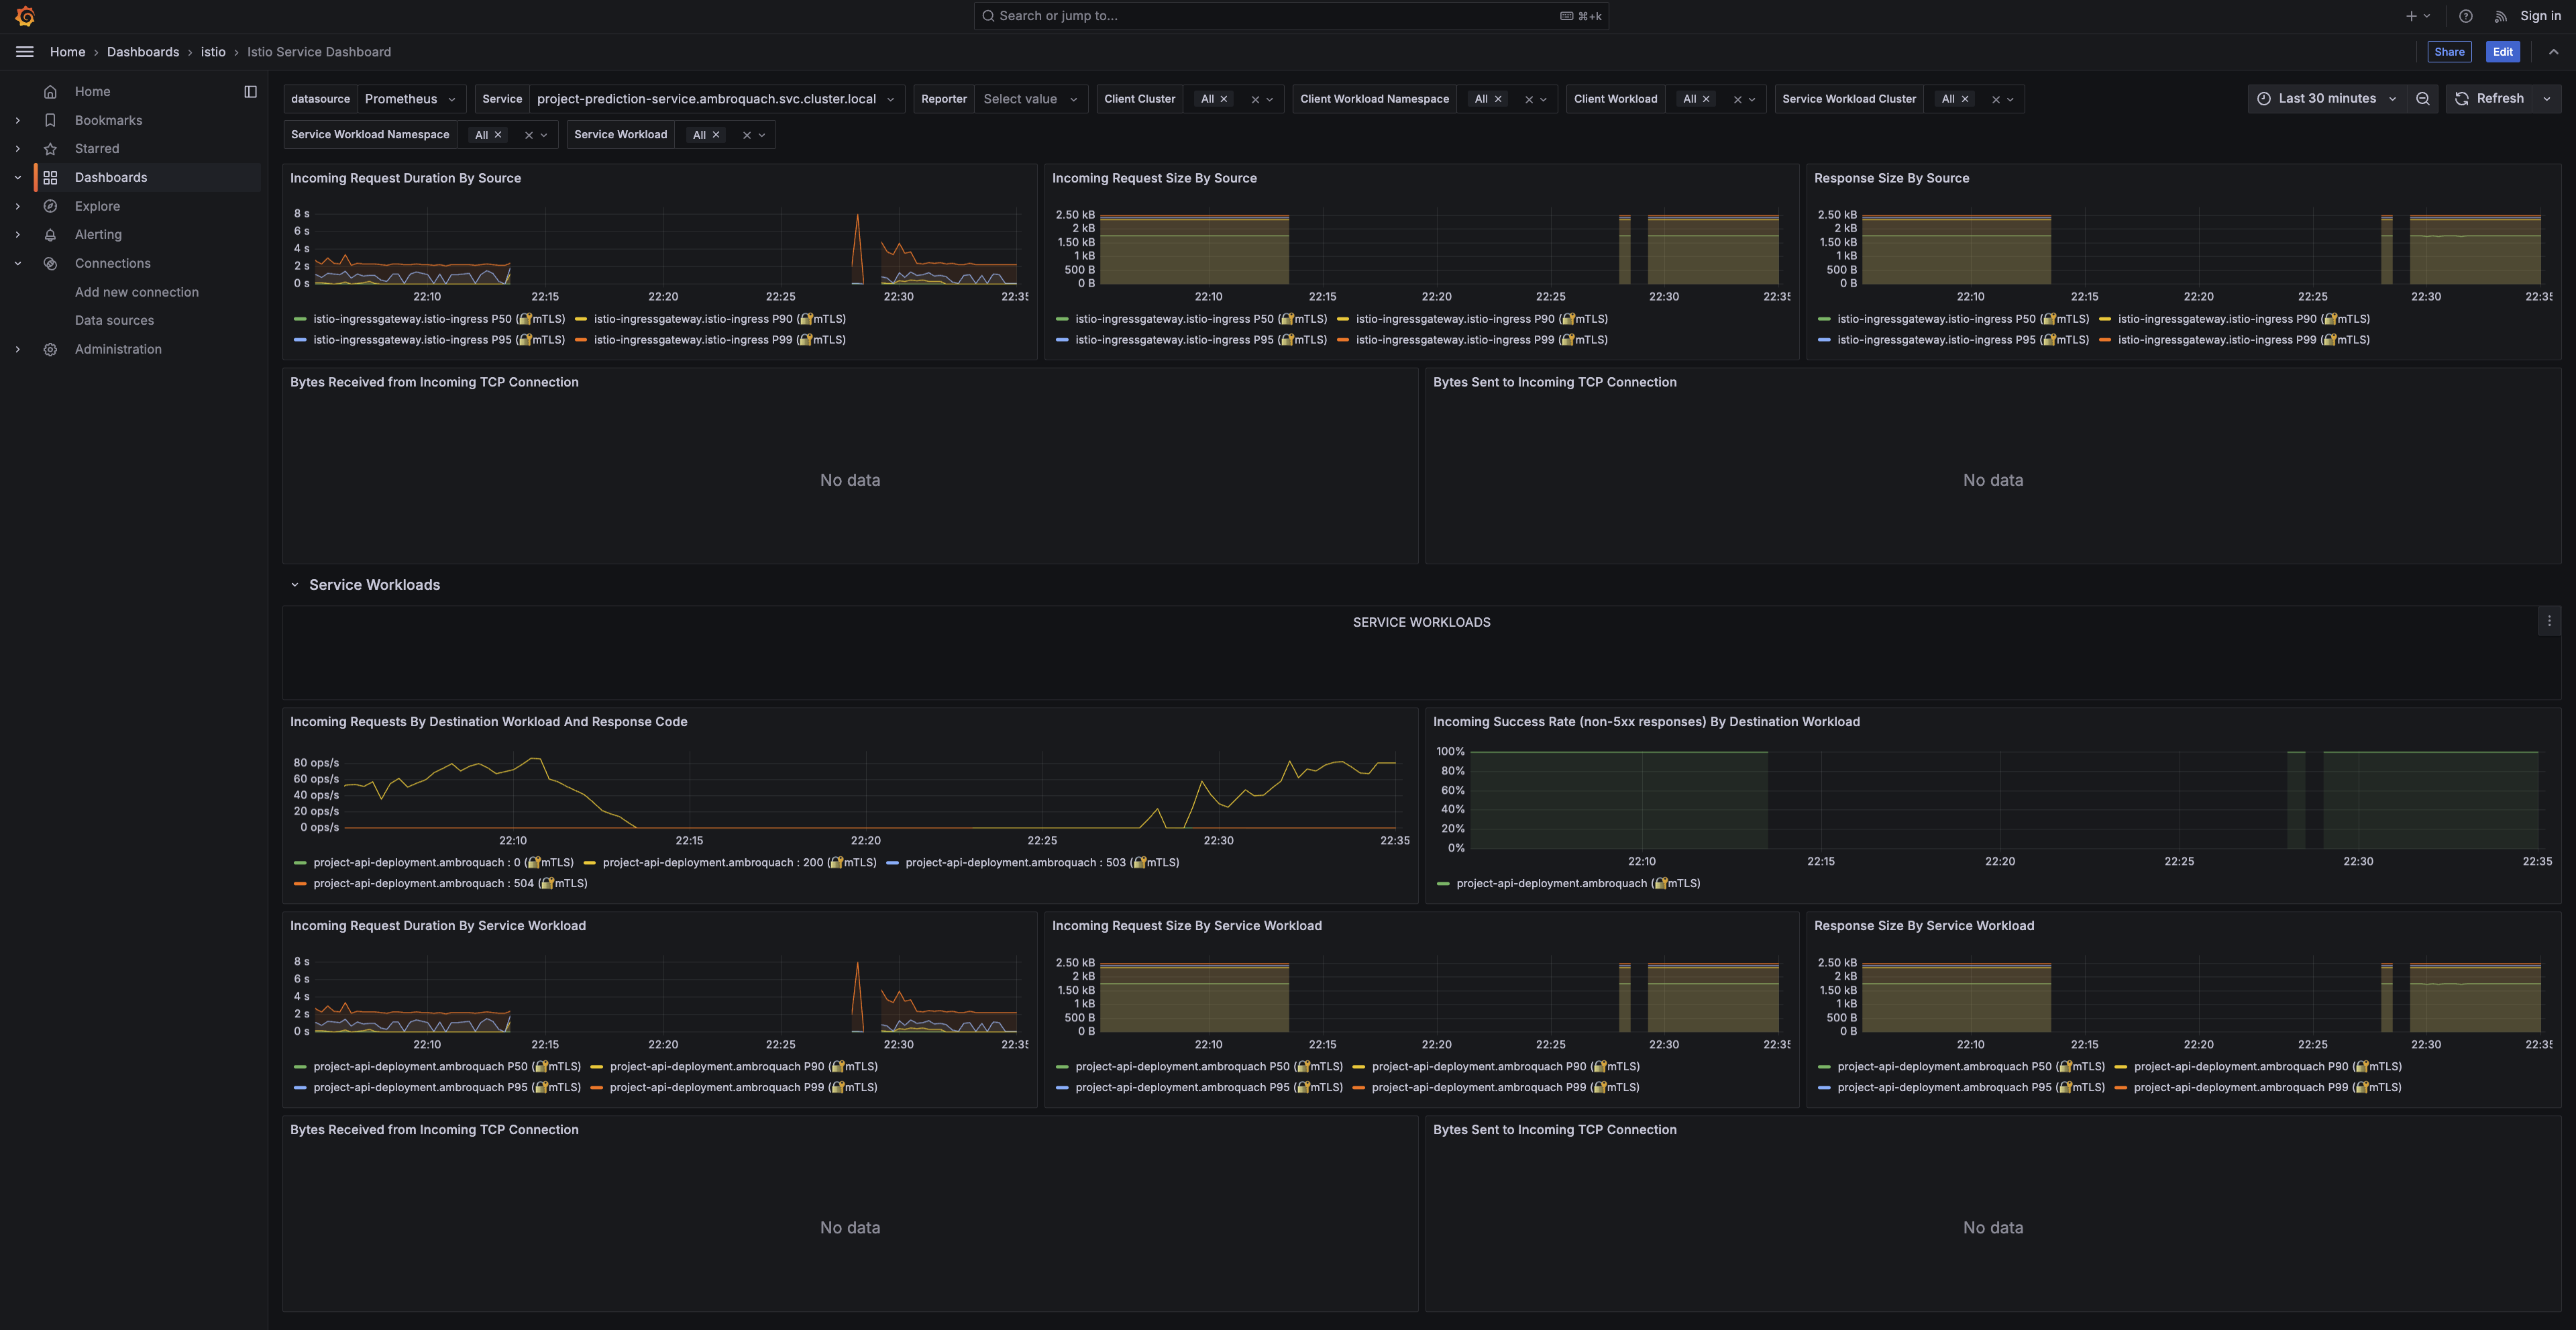
Request duration and size by source for the prediction service, confirming consistent behavior across the workloads calling it.
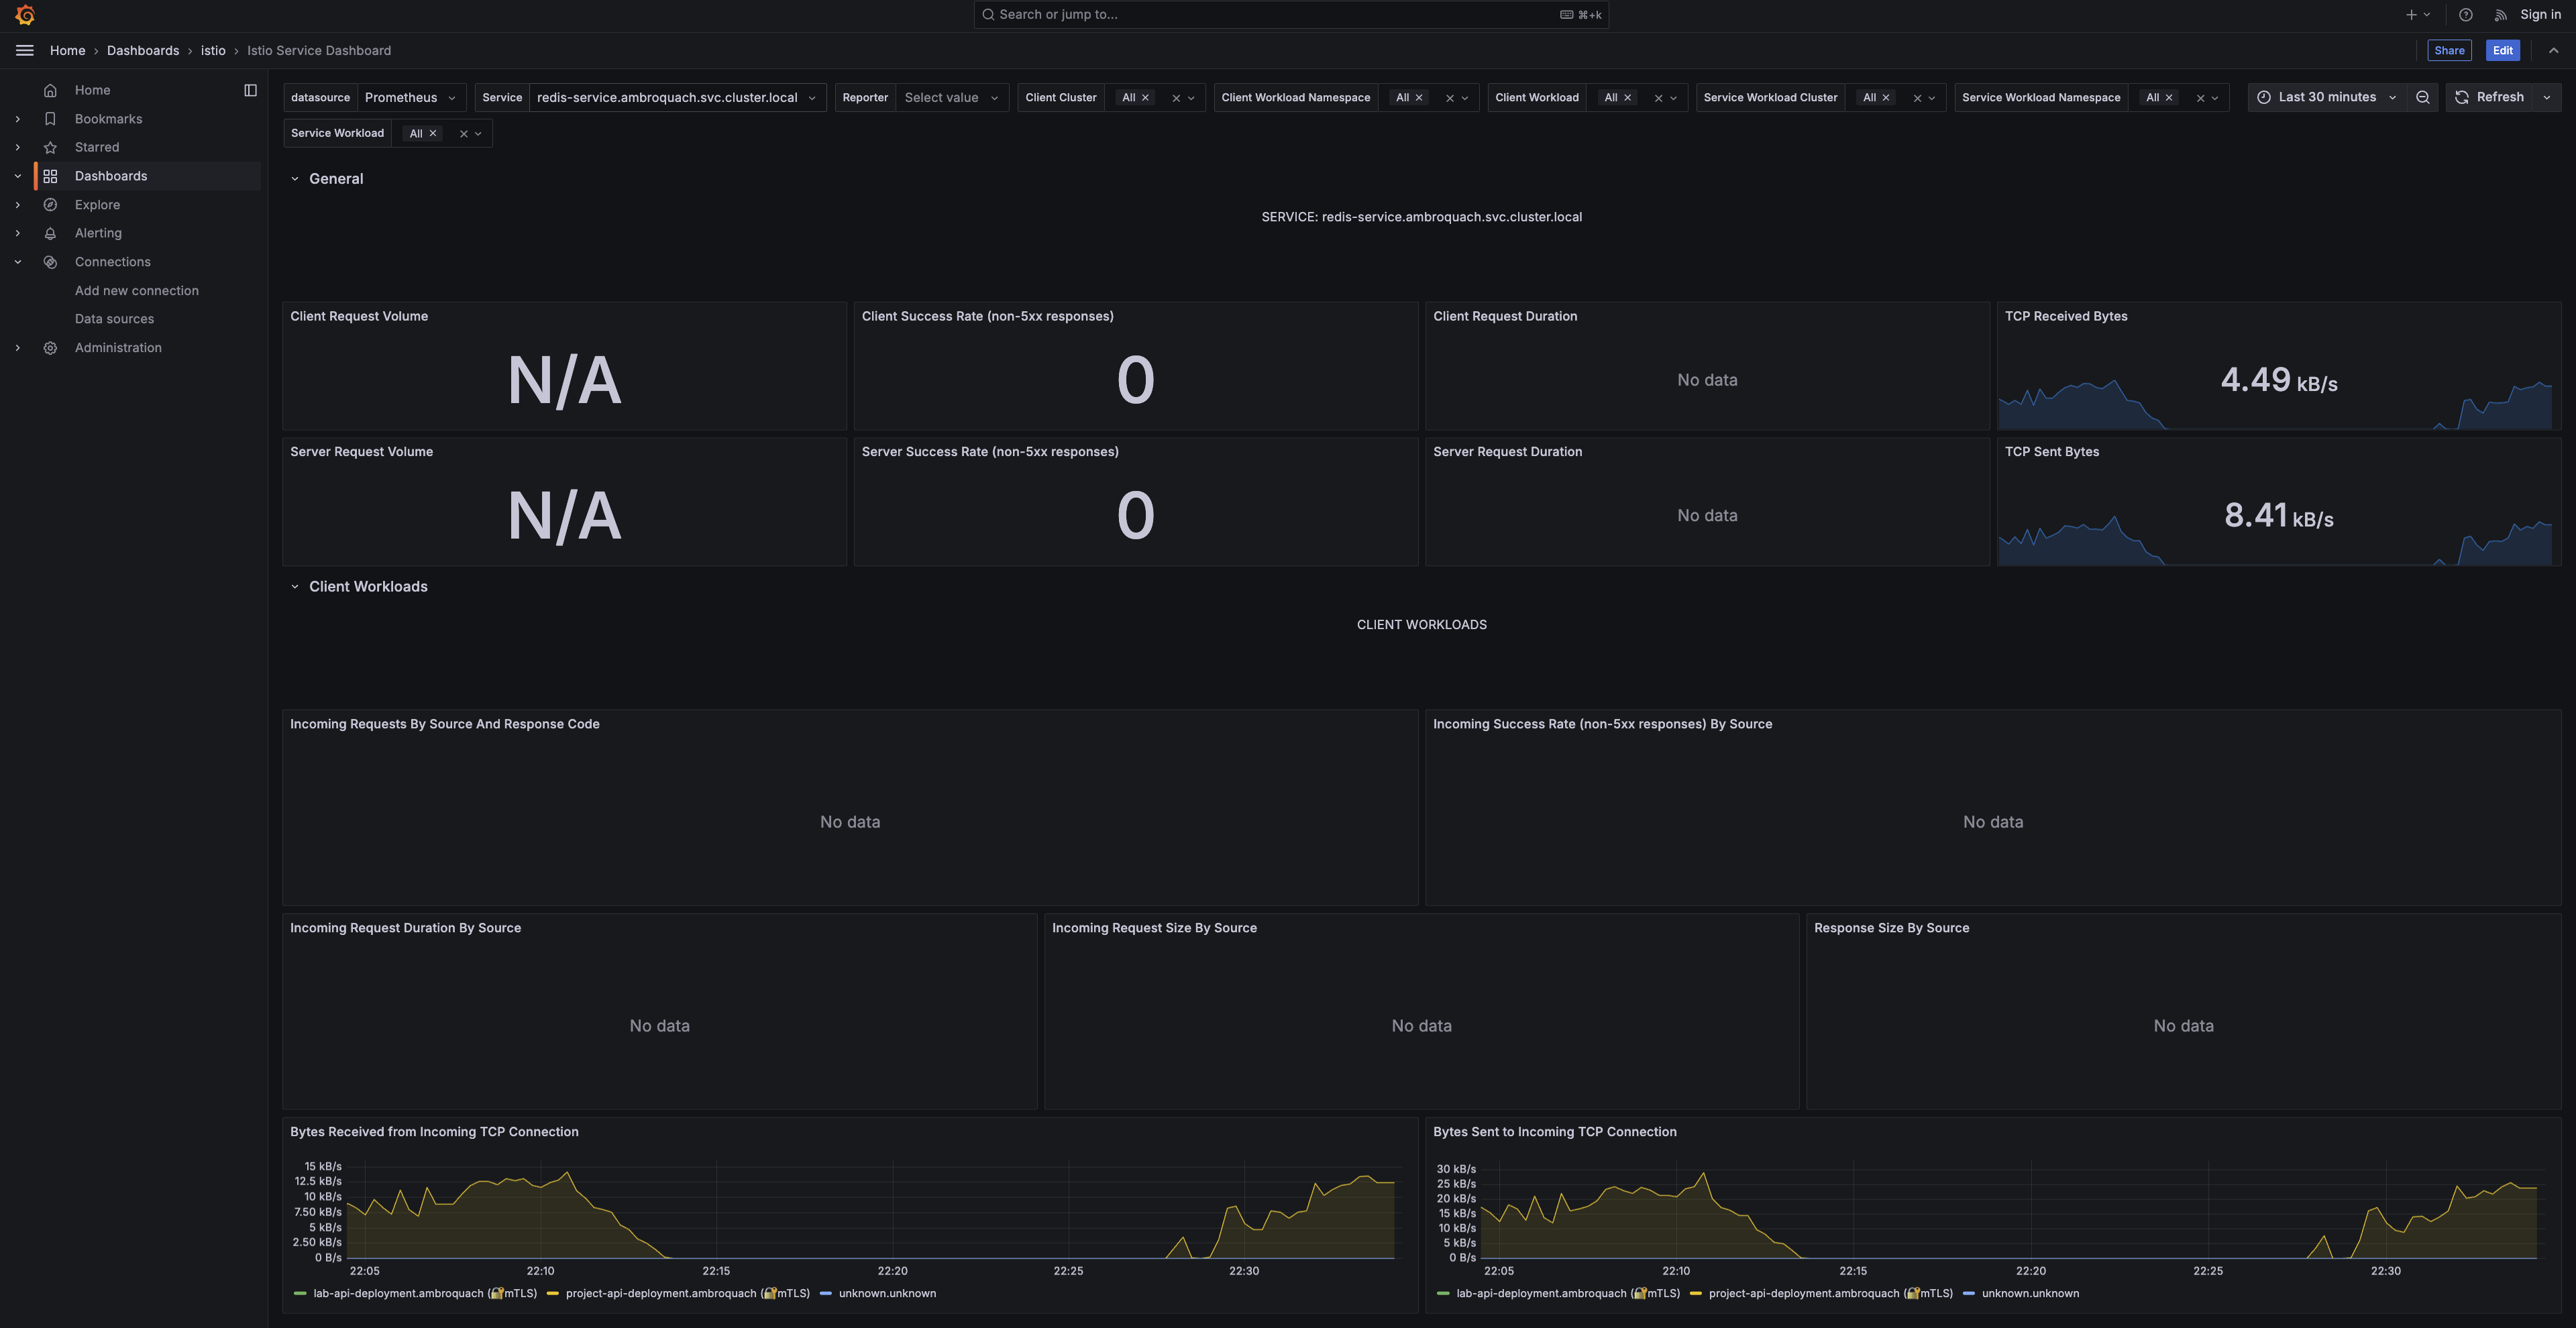
The Redis service dashboard. Redis speaks TCP rather than HTTP, so the HTTP panels read N/A while the TCP panels carry the signal: ~4.5 kB/s received.
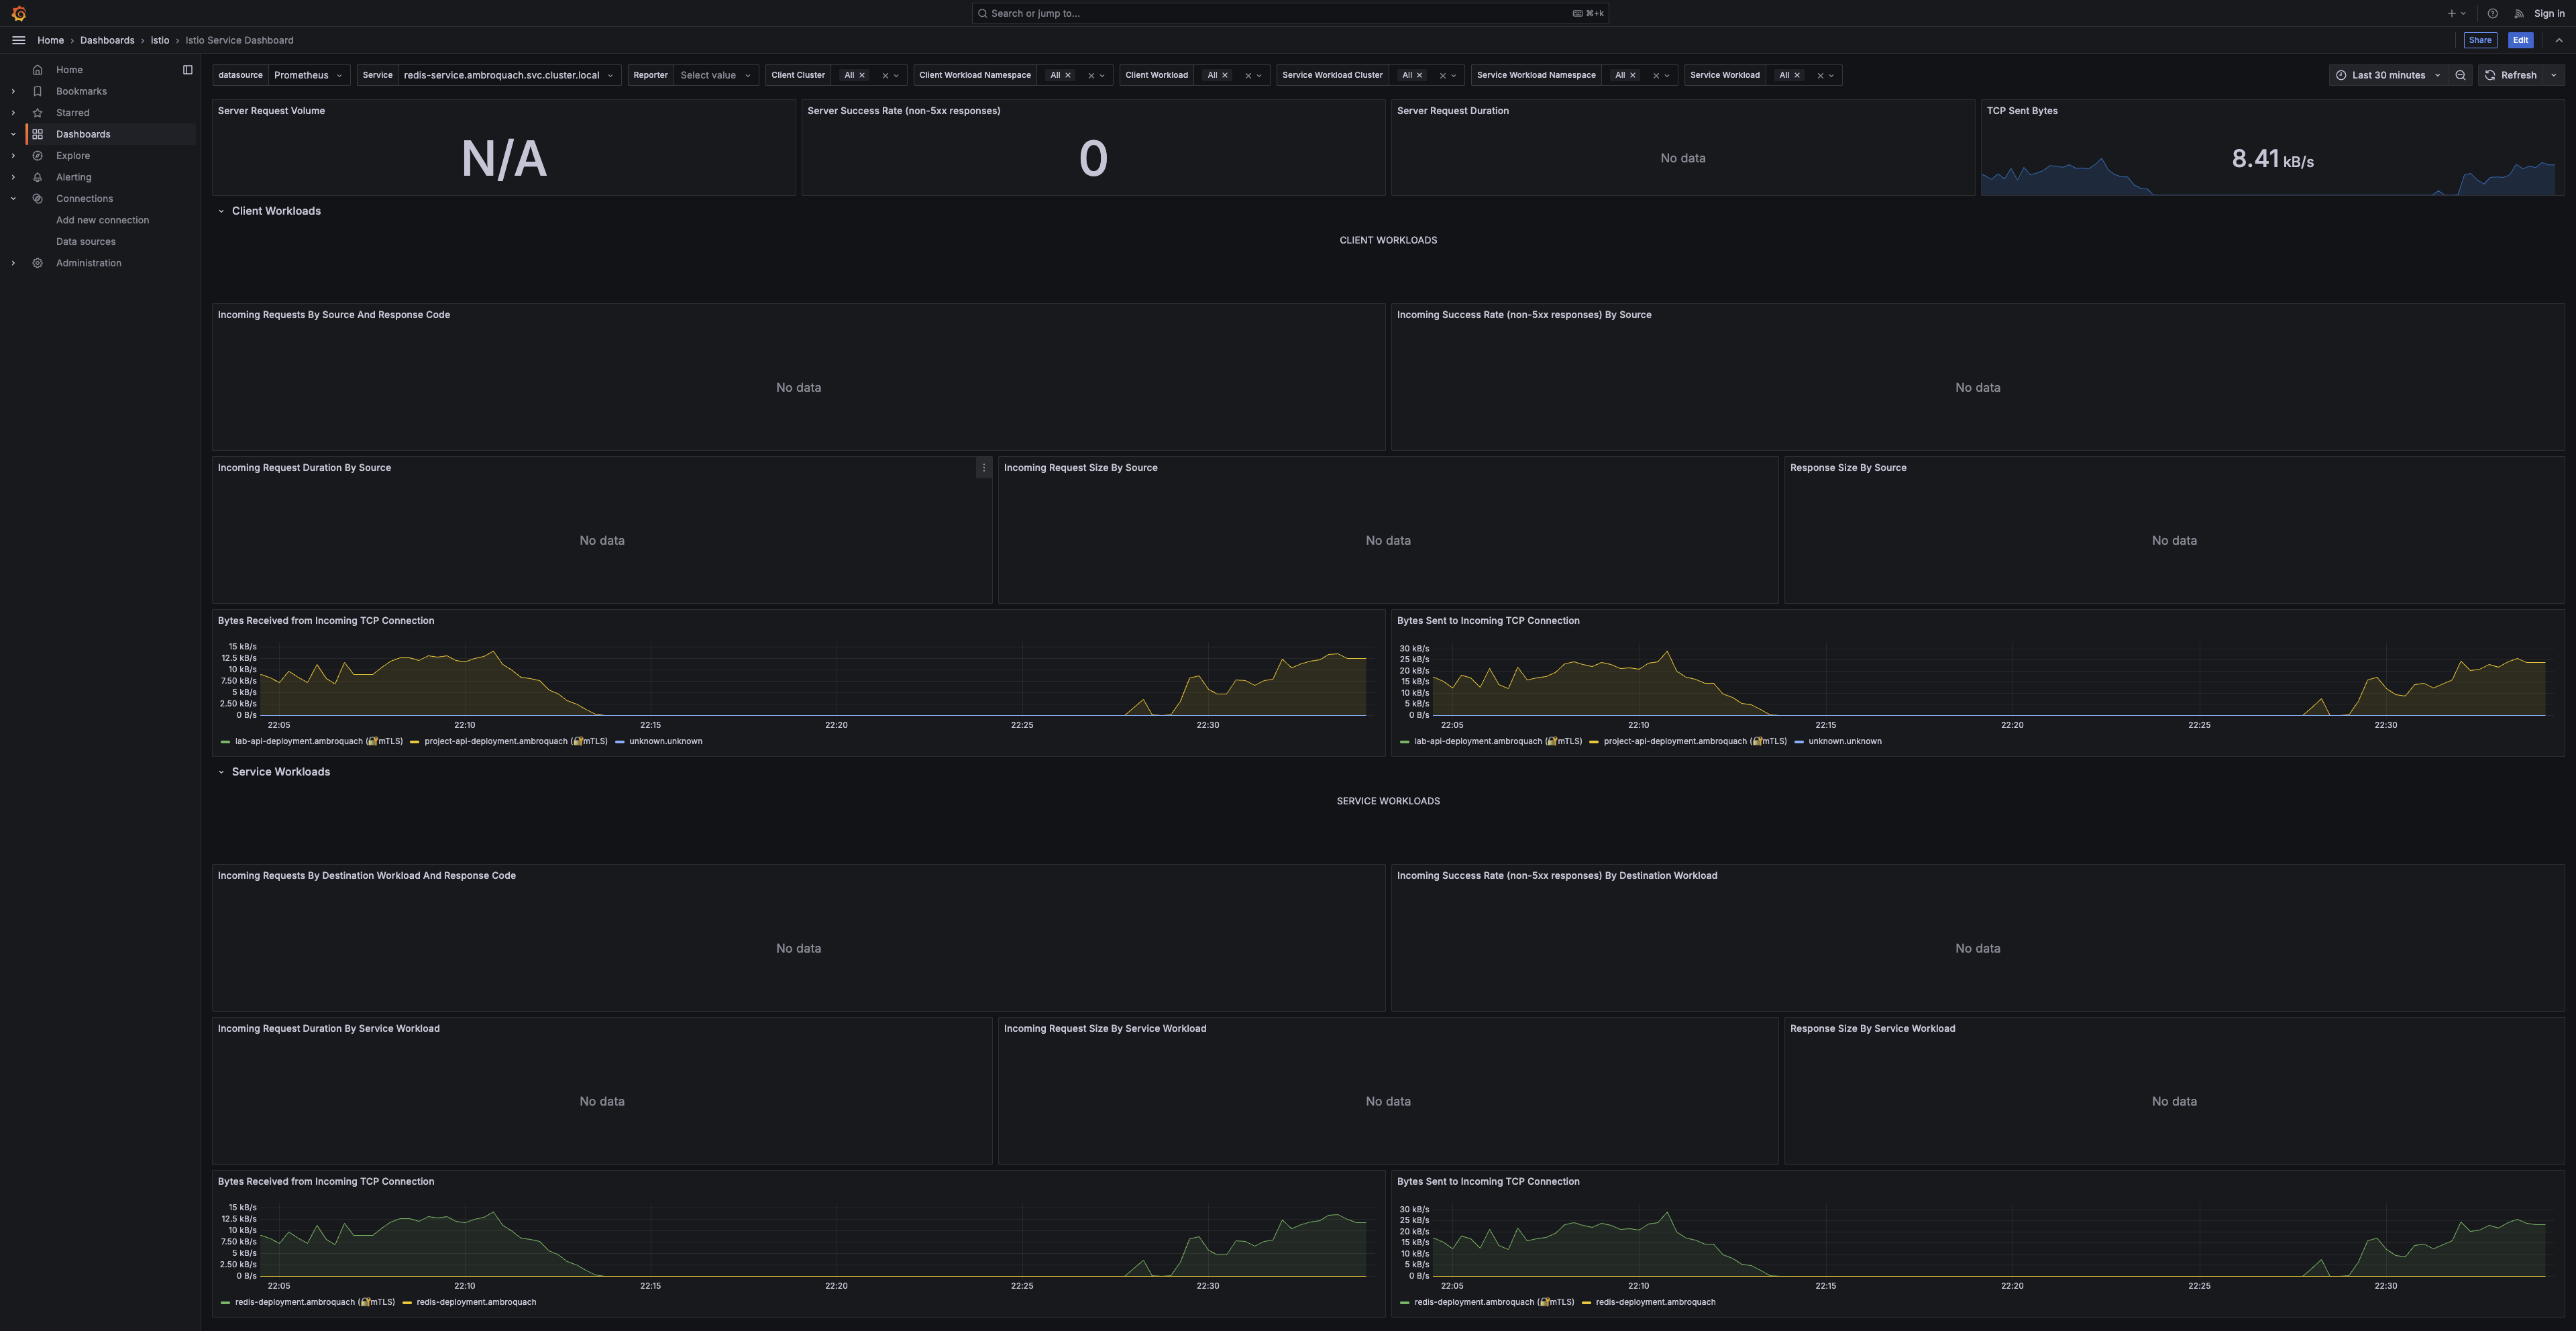
Redis TCP throughput — ~8.4 kB/s sent — split across the lab and project deployments that share the cache.
X. What Actually Mattered
Four decisions did the heavy lifting, and none of them was about the model:
- Cache like it's the architecture, not an optimization. At a 95% hit rate the median request never touches the model. The cache is the reason a slow transformer feels fast.
- Bake the model into the image. Fast pod cold-starts are what make autoscaling actually responsive; a model pulled at startup defeats the purpose of scaling.
- Keep blocking inference off the event loop. A thread pool plus a hard timeout keeps one slow prediction from taking the whole service down with it.
- Degrade gracefully. A 504 on a timed-out cold miss is a far better failure than a hung connection — and it's the difference between 99.8% success and a cascade.
A model that scores well in a notebook is a hypothesis. A model that holds p99 under two seconds at fifty requests a second, behind a cache, on a cluster that scales itself, is a service. This project was about crossing that line.
An ML-systems-engineering project from UC Berkeley's School of Information, by Ambro Quach.